
Other Forms of Government Intervention#
Price Controls#
The last type of government intervention is far more forceful than taxes and subsidies. Instead of changing the per-unit cost of a good paid by consumers or producers, price controls directly fix the market price. It does not change the amount different consumers are willing and able to pay or how much producers are willing and able to produce.
When price controls are introduced to a market, the equilibrium price and quantity no longer exist. Consumer and producers are forced to sell or buy goods at the prescribed price.
[Following image is a hand drawn diagram of a price floor]
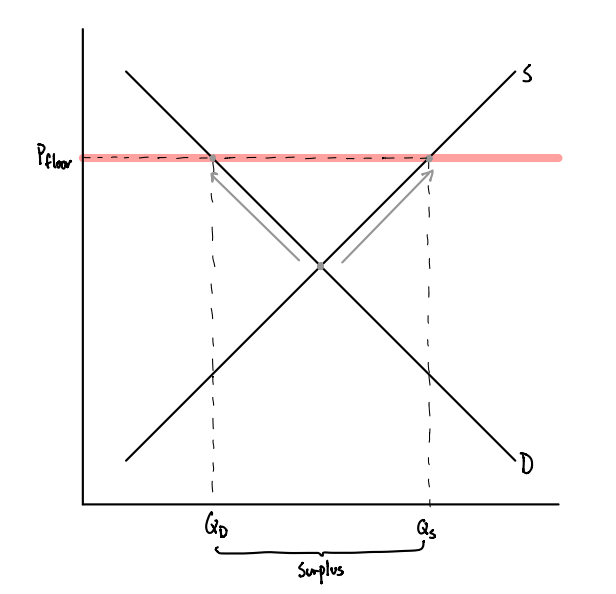
Fig. 11 A price floor#
Let’s take a price floor as the first example. This is when the government imposes a minimum price for which a good can be sold. For this to be effective, the price floor must be set above the equilibrium price, otherwise the market would just settle at equilibrium. This results in a surplus, as producers are willing to sell far more goods than consumers are willing to purchase. This results in a surplus as
Minimum wages act as a price floor, keeping wages above a certain level. At this higher rate, more workers are willing to work than there is demand for, creating unemployment.
[Following image is a hand drawn diagram of a price ceiling ]

Fig. 12 A price ceiling#
The other control is a price ceiling. This is when the government imposes a maximum price for which a good can be sold. This results in a shortage as consumers are to purchase more goods than producer are willing to sell:
Rent control in Berkeley acts as a price ceiling, keeping rents from rising above a certain level.
Optional: World Trade vs. Autarky#
Throughout the class so far, we have assumed that the economy is operating by itself, in isolation. Economists use the word “autarky” to represent the scenario when a country is economically self-sufficient. The key consequence of this is that the country’s economy is unaffected by global events, allowing us to conclude that any changes to equilibrium price or quantity are purely a result of shifts in domestic demand or supply.
We will now assume that the country is no longer in autarky, and is thus subject to world prices, demand and supply.
We now label our demand and supply curves as domestic demand and supply, respectively. Their intersection represents where the market would be if we were in autarky. However, as we are now open to world trade, the price where the market operates is now determined by the world price, which may be totally different from the equilibrium price.
Where the world price line intersects with domestic demand represents the total quantity demanded within the market. Where it intersects with the domestic supply curve is the total quantity supplied.
[Following image is a hand drawn diagram of a market with trade]
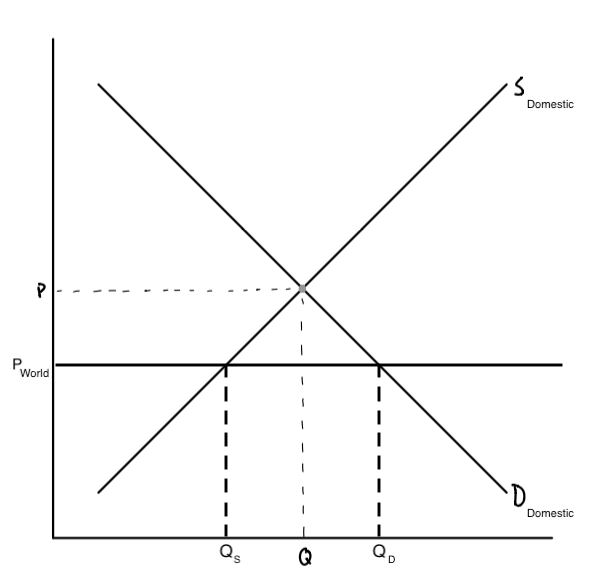
Fig. 13 Domestic supply and demand in the world market#
Let’s first imagine a scenario where world price is lower than domestic price. From our graph, we find that
Now, let’s imagine that world price is greater than domestic price. In this case,